Project Summary
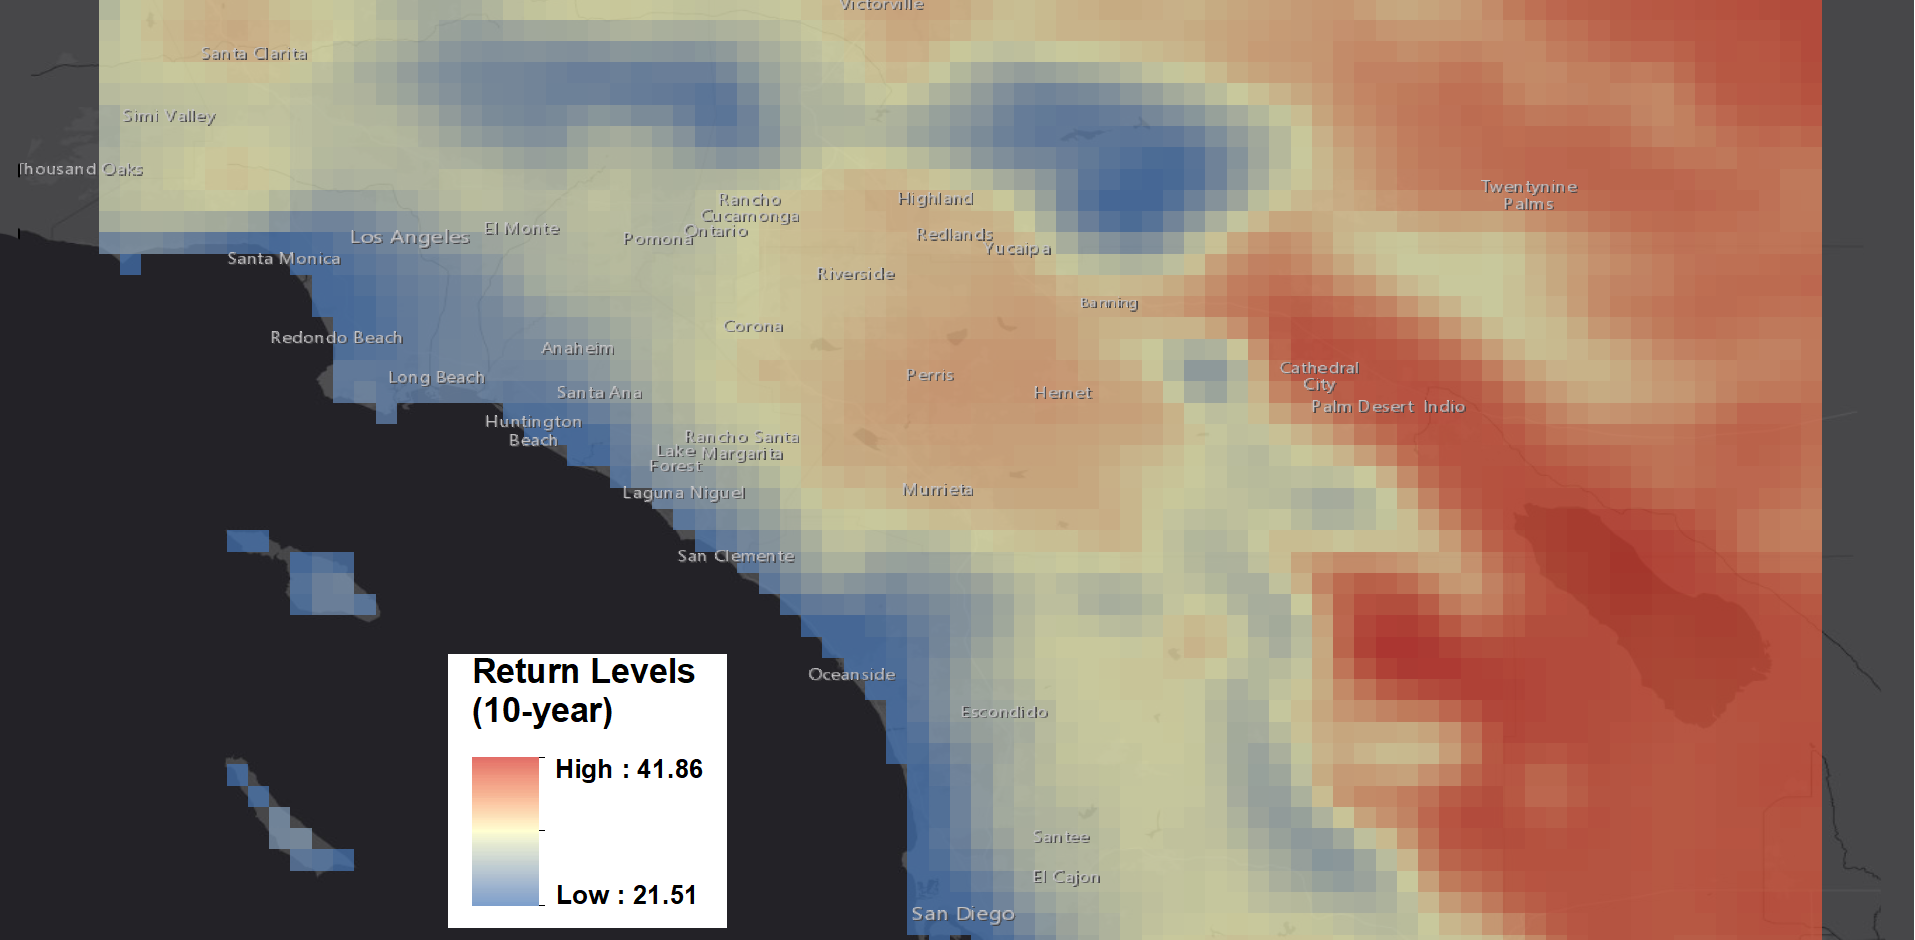
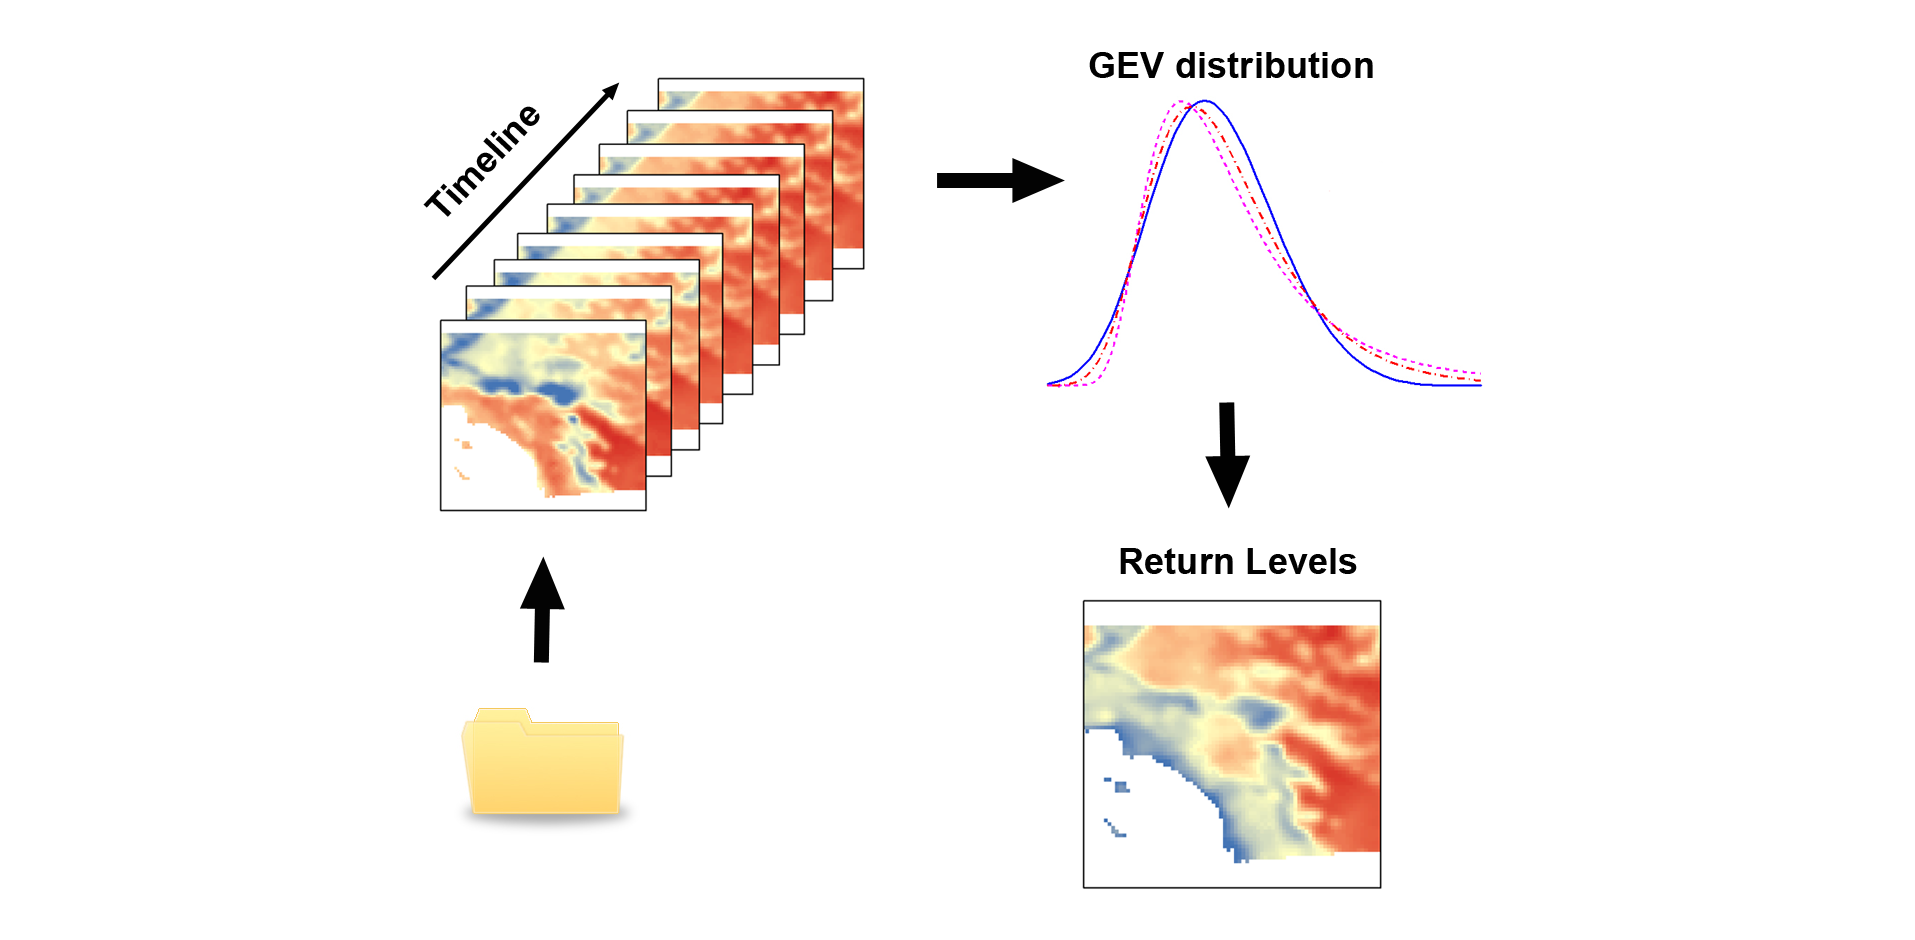
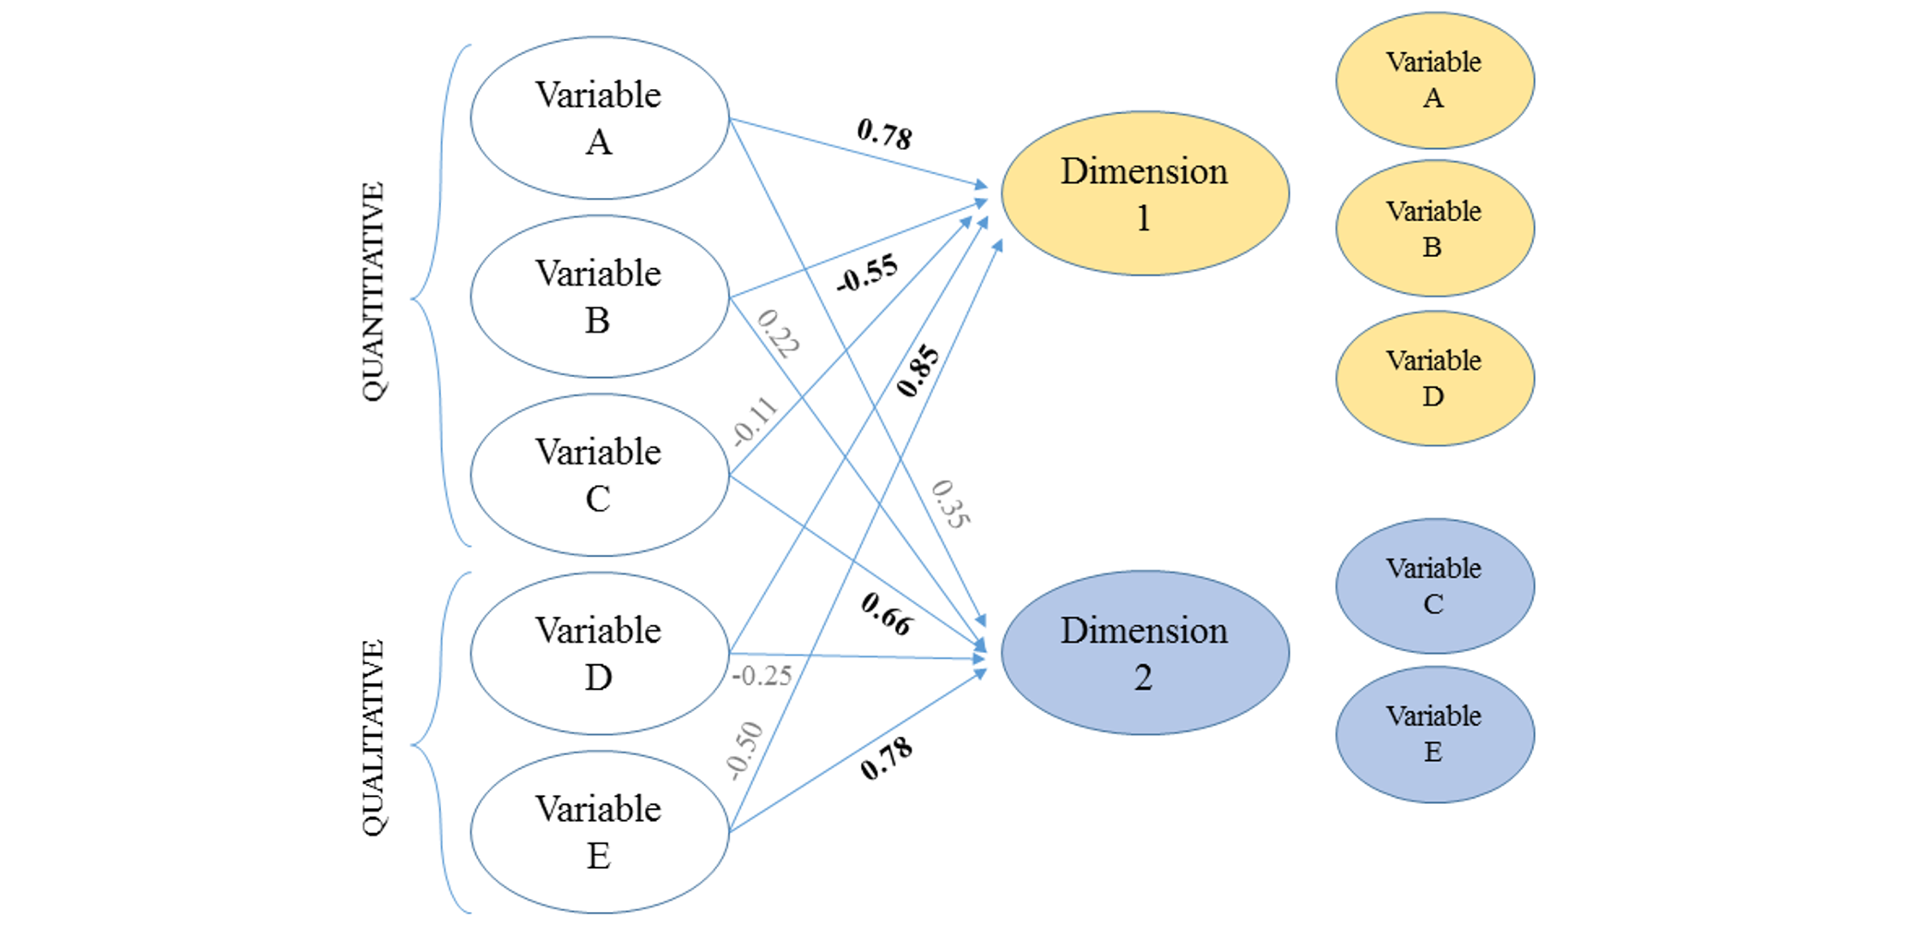
Back in 2013, I started exploring the integration between ArcGIS and R to create my own custom analysis tools. On one hand, coming from the R world, I was simply curious to explore a new way to make the two programming architectures (Python and R) talk to each other. On the other hand, I wanted to take advantage of the plethora of statistical packages available in R. At the time, the only way to have ArcGIS and R talk to each other was to (1) create a Python script reading user parameters from the ArcGIS GUI, (2) calling the R executable to run an R script containing the bulk of the analysis, and (3) sending the result back to the Python script and ArcGIS for visualization. This integration is now much more advanced, thank to the R-ArcGIS Bridge. Over the years, I have developed tools to run factor analysis for mixed data, network analysis grouping, and extreme value analysis to calculate return values from a time series of gridded datasets.
Objectives
- Use the R-ArcGIS Bridge to transfer data back and forth between ArcGIS and R
- Take full advantage of all of the libraries and functions in R as a complement to the spatial analysis and mapping powers of ArcGIS
Technology
Project Website:
https://github.com/R-ArcGIS/CHANS-tools
https://github.com/f-tonini/R-GriddedExtremes-py
Deployment Architecture:
ESRI R-bridge, ESRI ArcGIS (Enterprise, Dekstop), Amazon Web Services (AWS)
Language:
Python, R