Project Summary
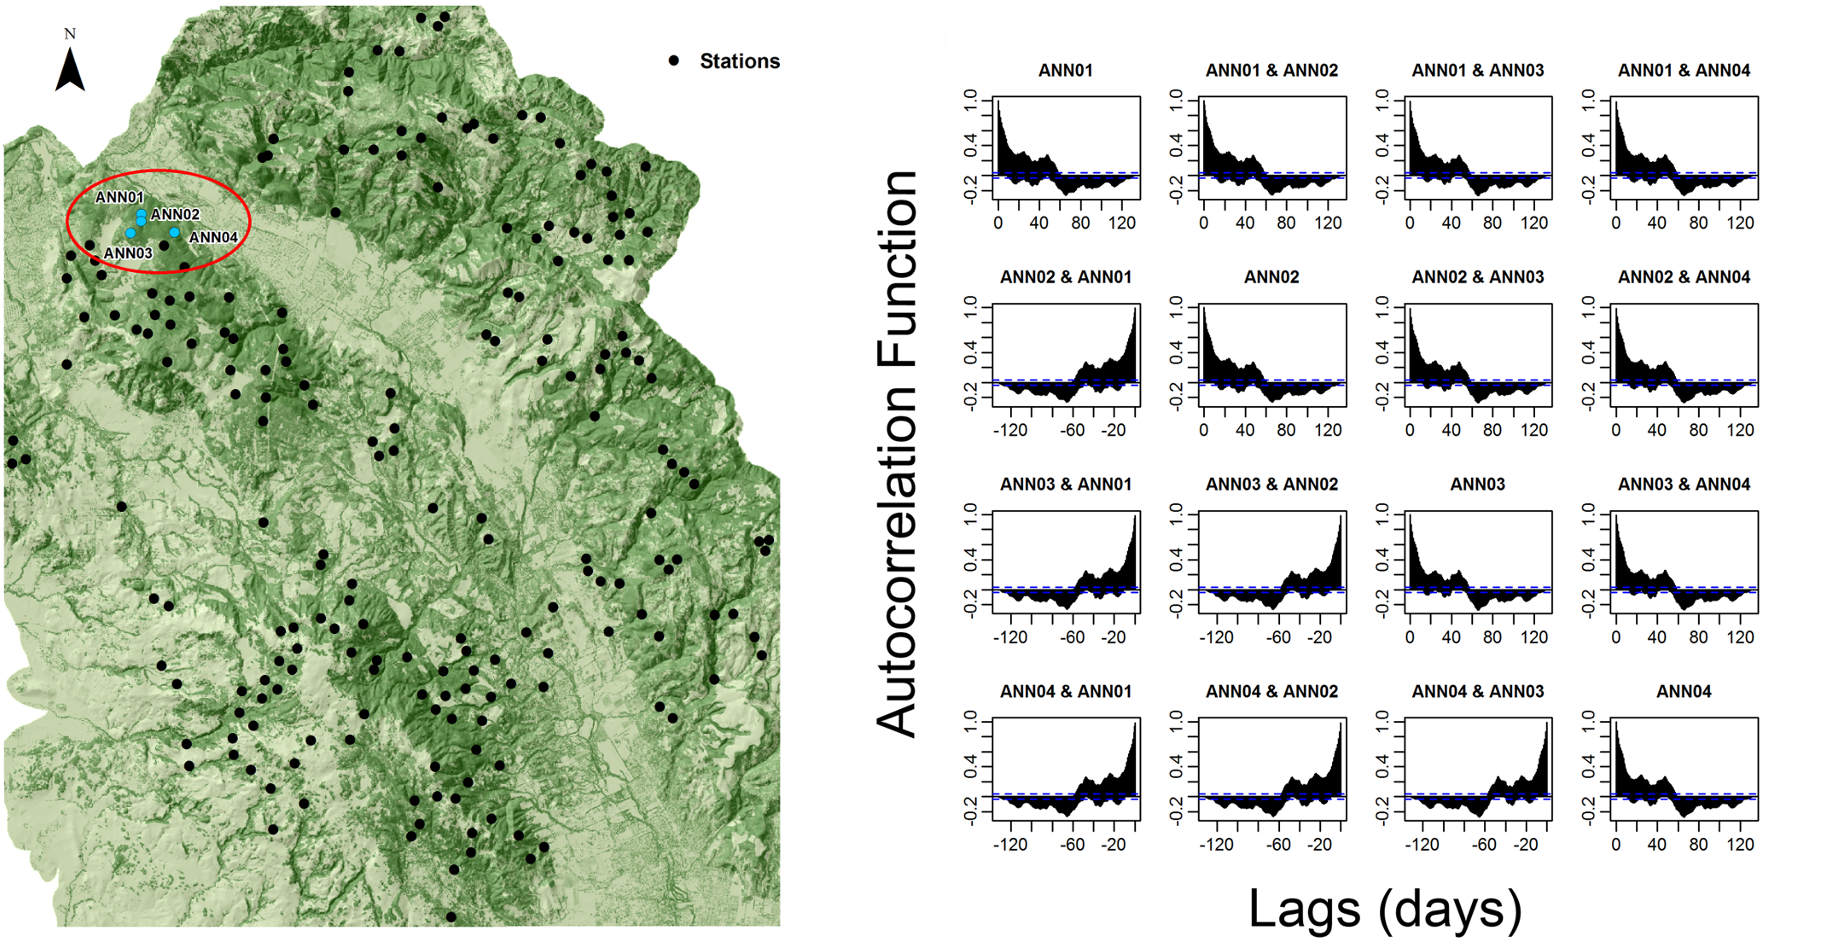
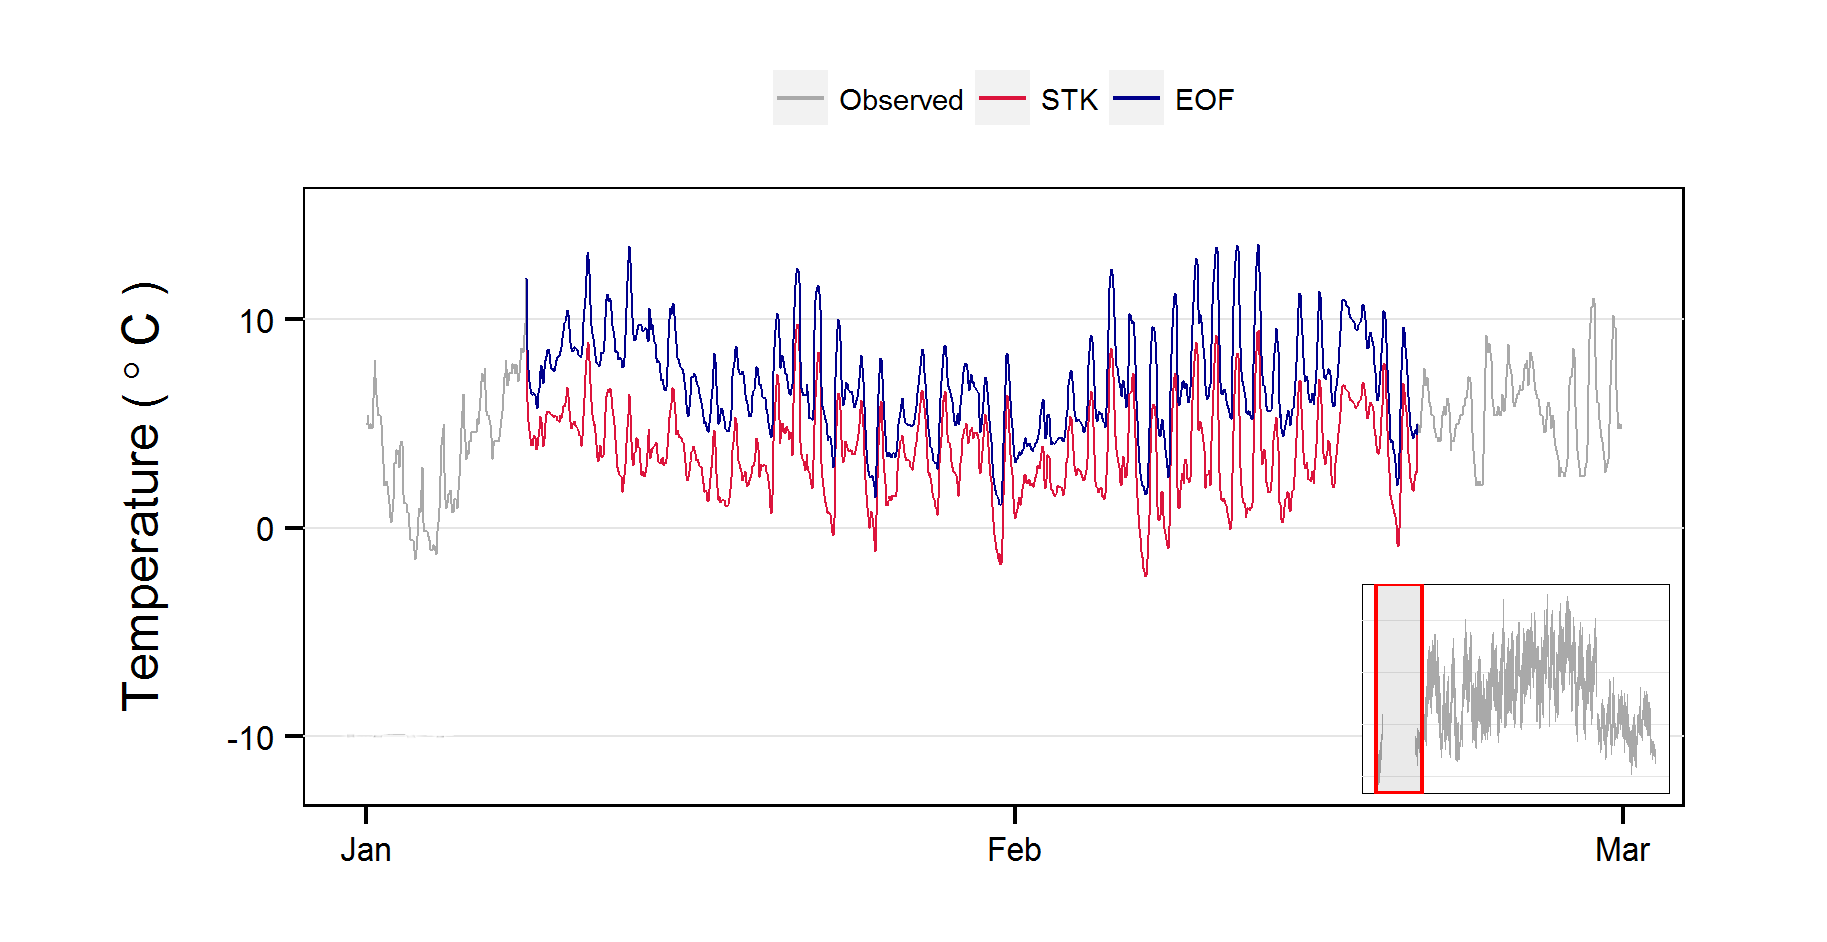
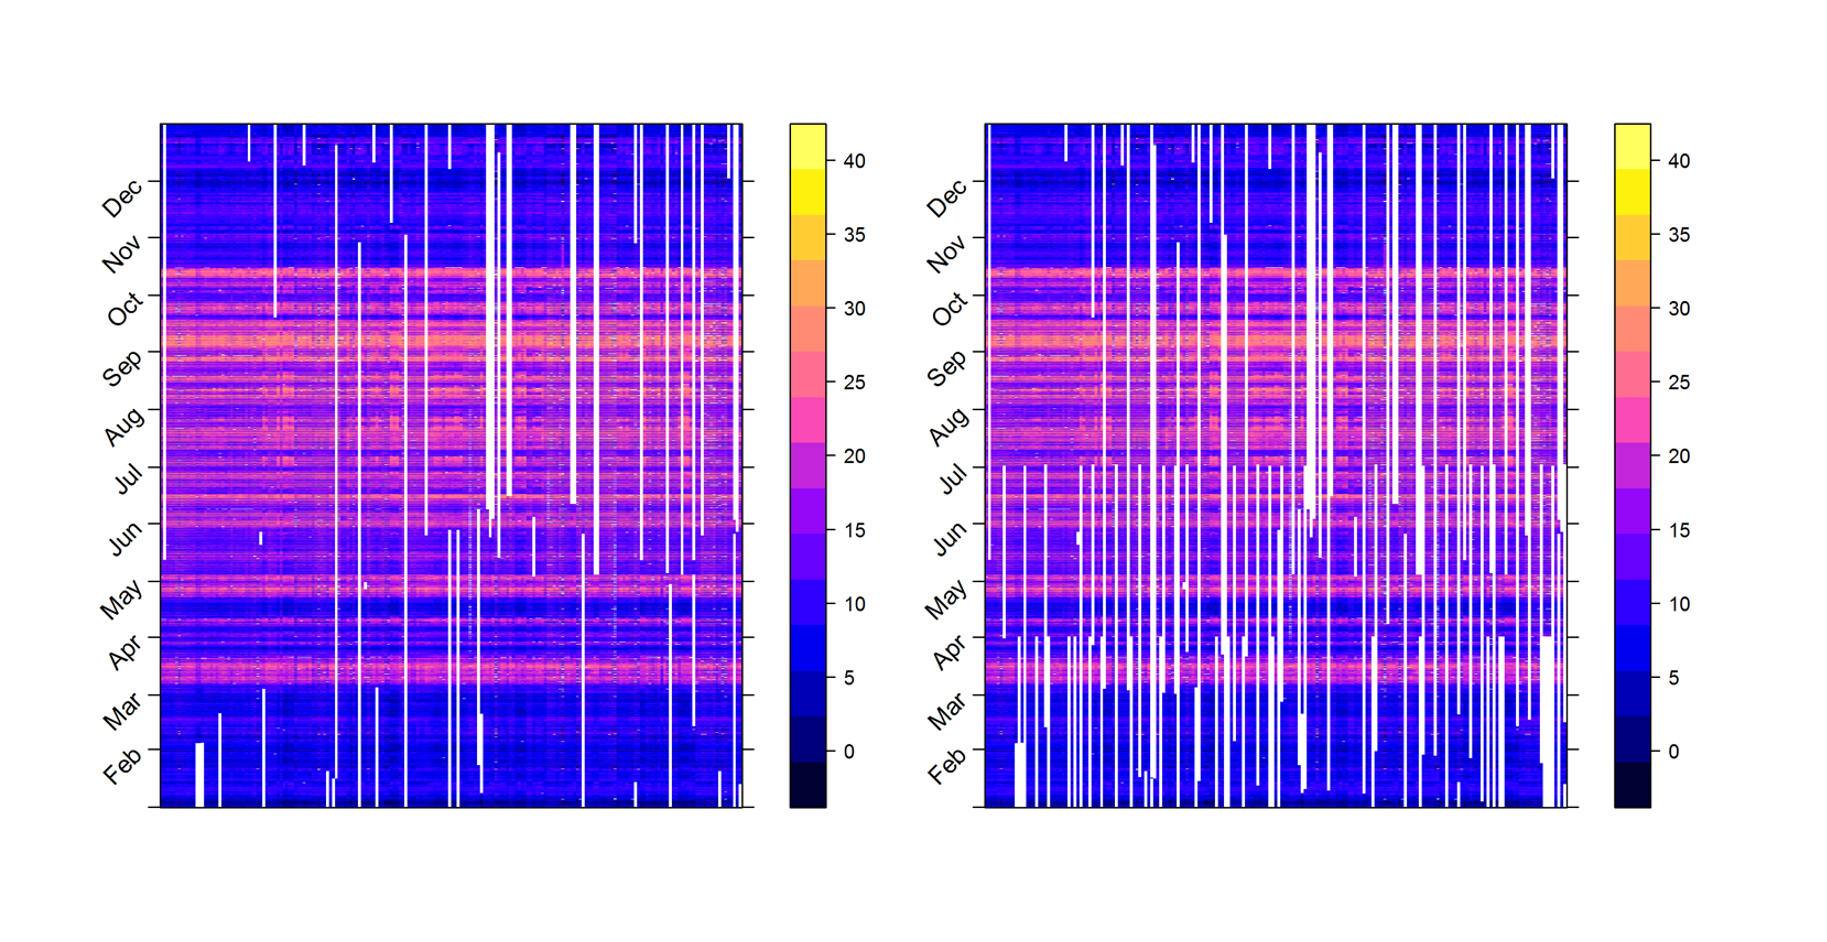
Scientists and land managers are increasingly monitoring forest microclimate environments to better understand ecosystem processes, such as carbon sequestration and the population dynamics of species. Obtaining reliable time-series measurements of microclimate conditions is often hindered by missing and erroneous values. In this study, we compare spatio-temporal techniques, space–time kriging (probabilistic) and empirical orthogonal functions (deterministic), for reconstructing hourly time series of near-surface air temperature recorded by a dense network of 200 forest understory sensors across a heterogeneous 349 km2 region in northern California. Empirical orthogonal functions performed best at both the hourly and daily time scale. We analyzed several scenarios to understand the effects that spatial coverage and patterns of missing data may have on model accuracy: (a) random reduction of the sample size/density by 25%, 50%, and 75% (spatial coverage); and (b) random removal of either 50% of the data, or three consecutive months of observations at randomly chosen stations (random and seasonal temporal missingness, respectively). Here, space–time kriging was less sensitive to scenarios of spatial coverage, but more sensitive to temporal missingness, with less marked differences between the two approaches when data were aggregated on a daily time scale.
Objectives
- Compare spatio-temporal techniques, space–time kriging (probabilistic) and empirical orthogonal functions (deterministic), for reconstructing hourly time series of near-surface air temperature
- Contextualize trade-offs between techniques and provides practical guidelines, with free source code, for filling data gaps depending on the spatial density
- Aggregate the reconstructed data to daily mean, minimum, and maximum in order to understand the sensitivity of model predictions to temporal scale of measurement
Technology
Project Website:
https://doi.org/10.1016/j.agrformet.2015.11.004
Deployment Architecture:
R, ESRI ArcGIS
Language:
R