Project Summary
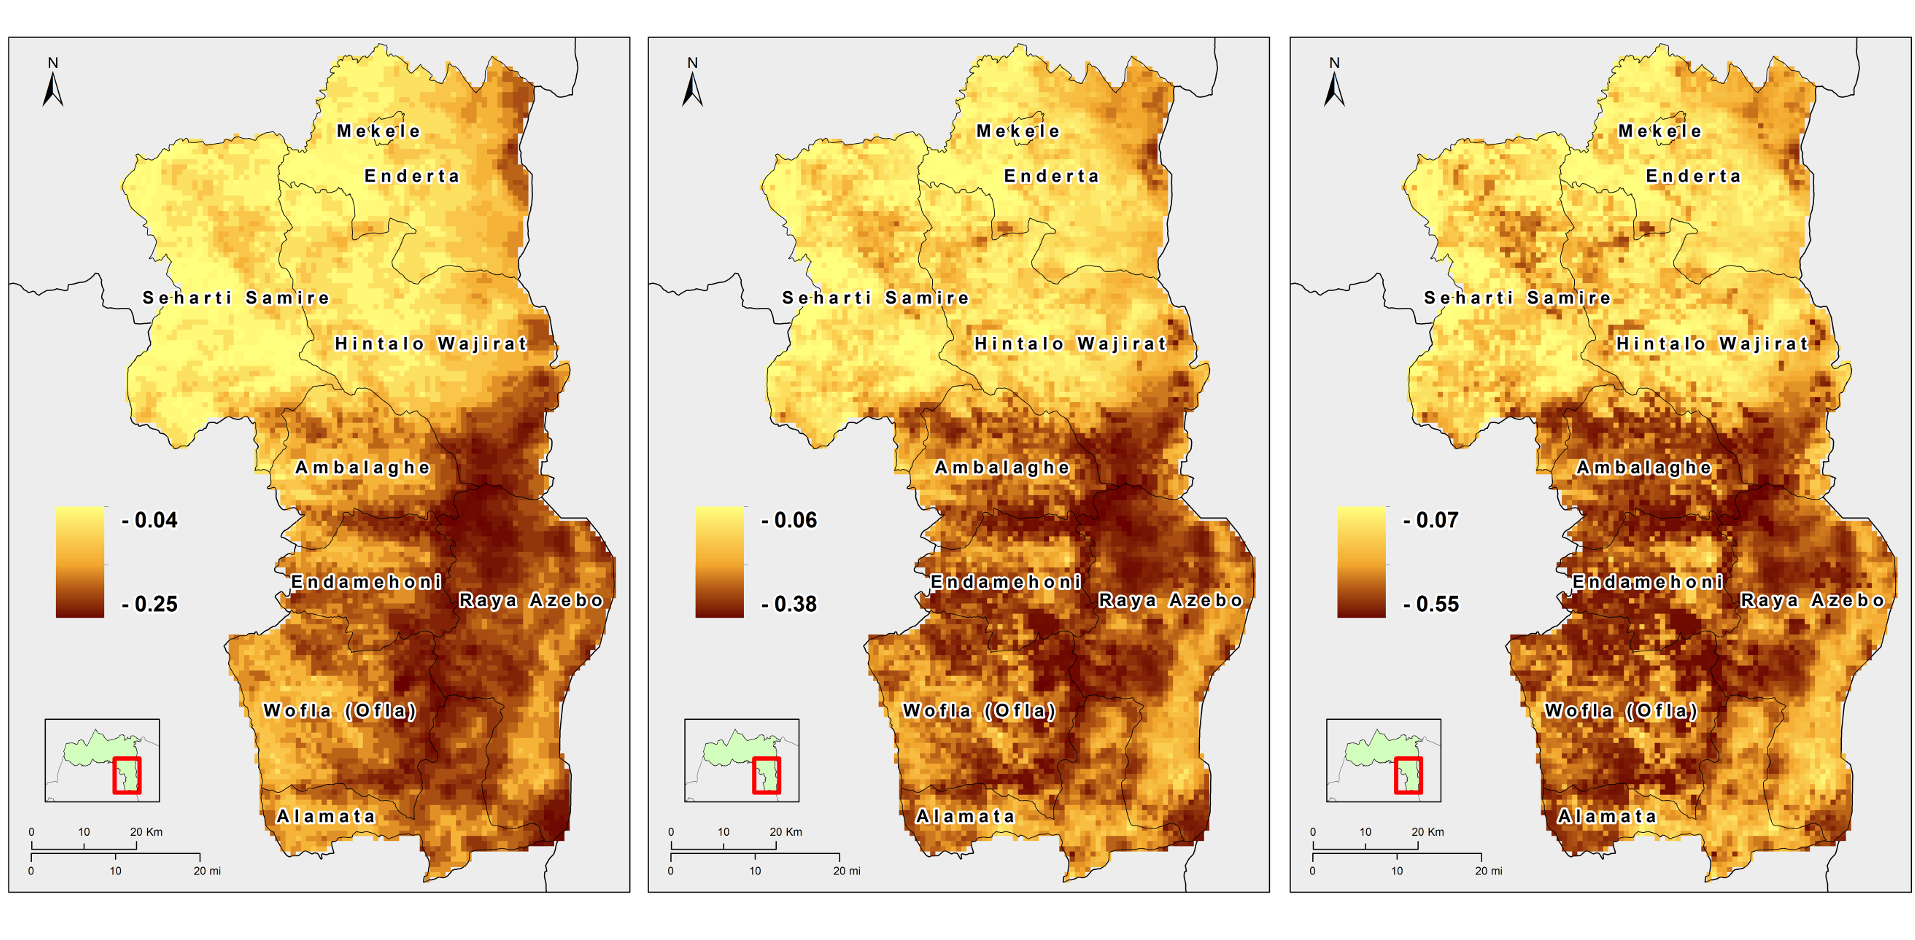
The analysis and forecasting of extreme climatic events has become increasingly relevant to planning effective financial and food-related interventions in third-world countries. Natural disasters and climate change, both large and small scale, have a great impact on non-industrialized populations who rely exclusively on activities such as crop production, fishing, and similar livelihood activities. It is important to identify the extent of the areas prone to severe drought conditions in order to study the possible consequences of the drought on annual crop production. In this study, we aim to identify such areas within the South Tigray zone, Ethiopia, using a transformation of the Normalized Difference Vegetation Index (NDVI) called Absolute Difference NDVI (ADVI). Negative NDVI shifts from the historical average can generally be linked to a reduction in the vigor of local vegetation. Drought is more likely to increase in areas where negative shifts occur more frequently and with high magnitude, making it possible to spot critical situations. We estimate ADVI return levels pixel per pixel by fitting extreme value models to independent monthly minima. The study is conducted using SPOT-Vegetation (VGT) ten-day composite (S10) images from April 1998 to March 2009. In all short-term and long-term predictions, we found that central and southern areas of the South Tigray zone are prone to a higher drought risk compared to other areas.
Objectives
- Propose a new methodology for the assessment of drought risk in areas where crop production represents a primary source of livelihood for its inhabitants
- Identify such areas within the South Tigray zone, Ethiopia, using a transformation of the Normalized Difference Vegetation Index (NDVI) called Absolute Difference NDVI (ADVI)
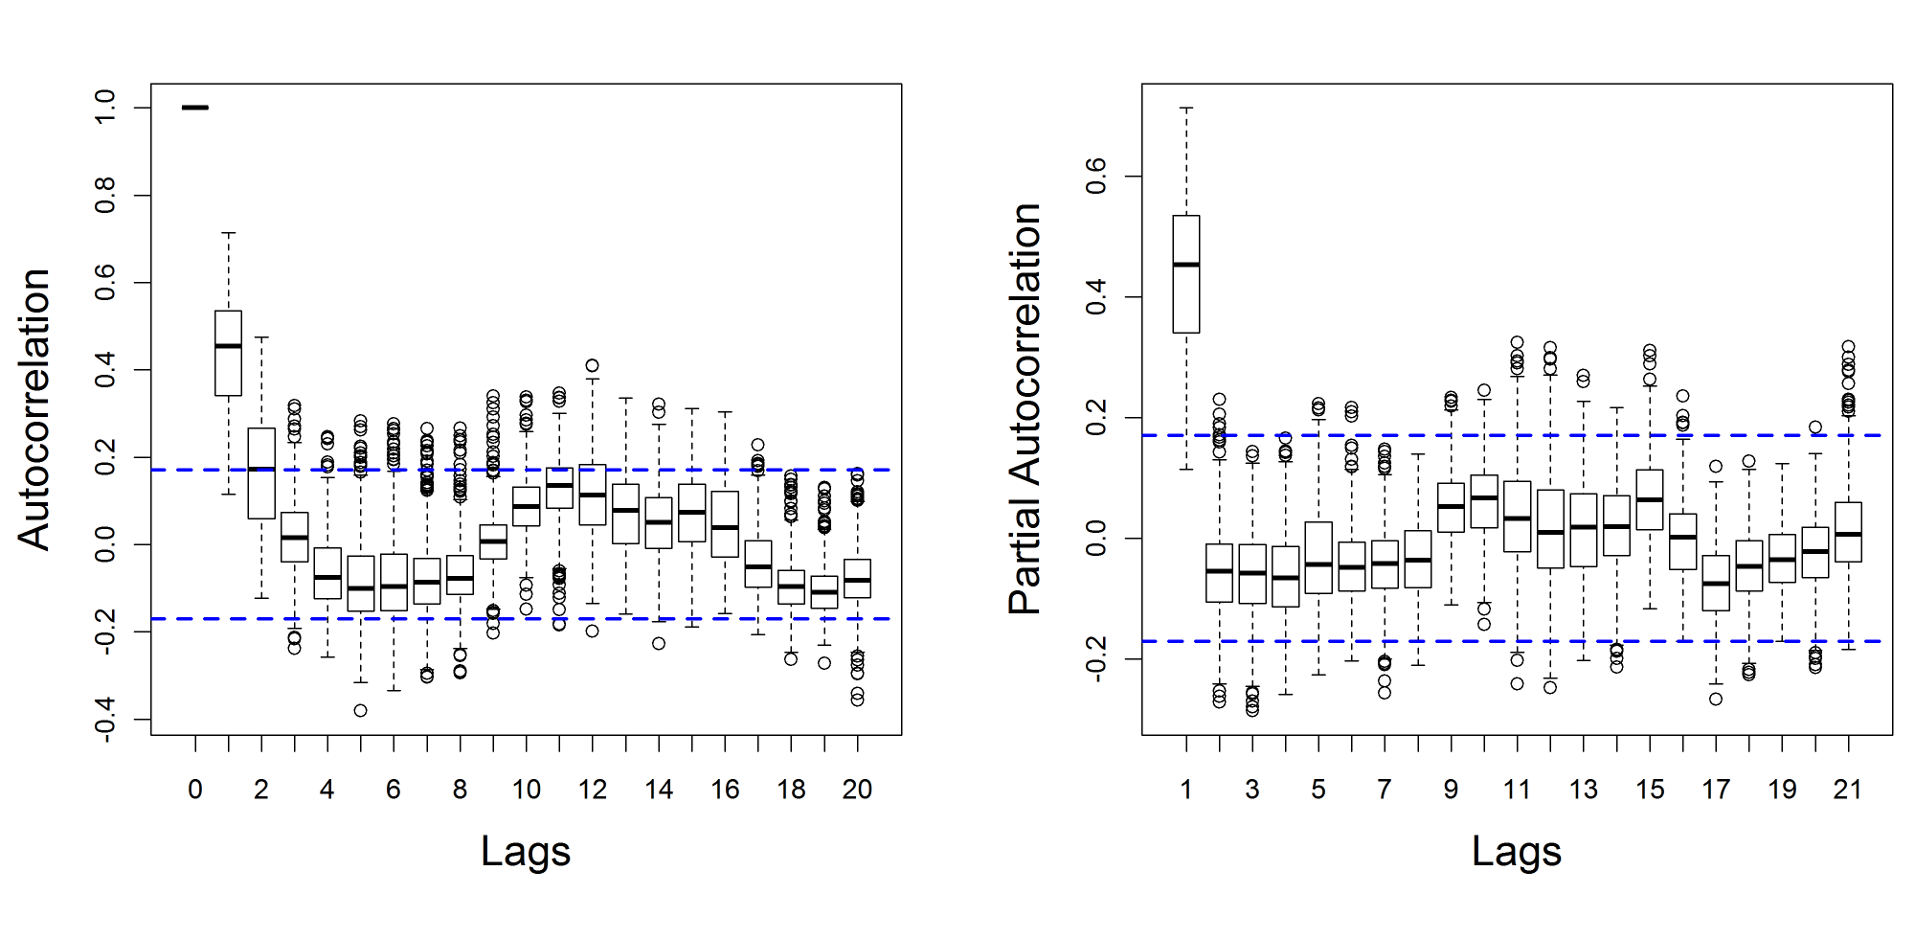
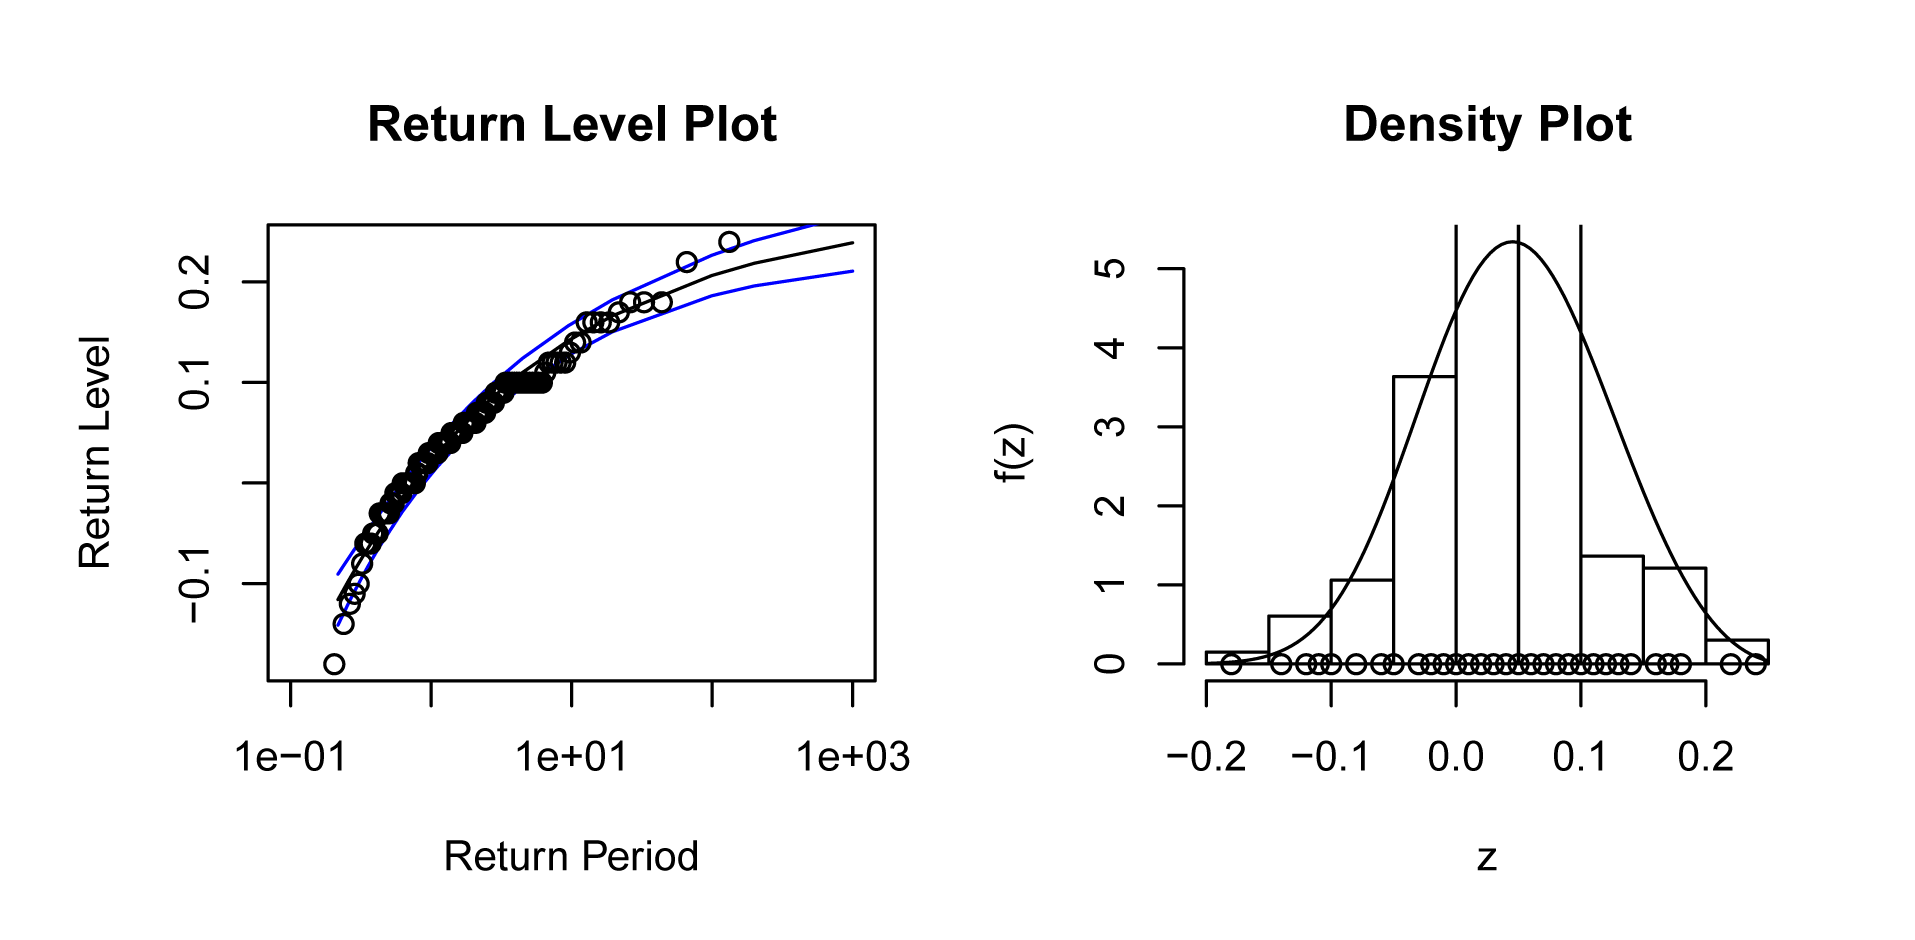
- Estimate ADVI return levels pixel per pixel by fitting extreme value models to independent monthly minima
Technology
Project Website:
http://dx.doi.org/10.1016/j.jag.2012.03.018
Deployment Architecture:
R, ESRI ArcGIS
Language:
R, Python