Presentation Title:
Drought Risk Assessment–A Customized Toolbox
Authors: Francesco Tonini, PhD, GISP
Download Presentation (.pptx)
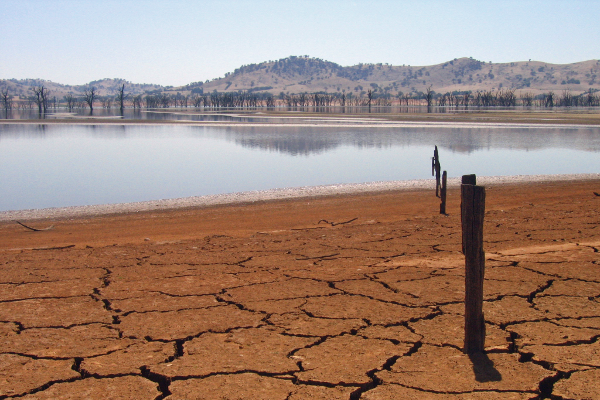
The analysis and forecasting of extreme climatic events has become increasingly relevant to planning effective financial and food-related interventions in third-world countries. This presentation illustrates the steps the authors have taken to build a customized toolbox within ArcGIS for the assessment of drought risk over a given area, making use of the extreme value theory. The Python programming language was used to customize the toolbox, while R, an open source programming language for statistical computing, was integrated to run the statistical analysis. As data input, users are asked to provide historical raster maps of a chosen drought indicator. A case study is illustrated, where return levels of absolute NDVI variations were estimated over the Ethiopian sub-region of South Tigray in order to identify the extent of the areas prone to severe drought conditions. The toolbox can also be used with other drought related indicators.